")
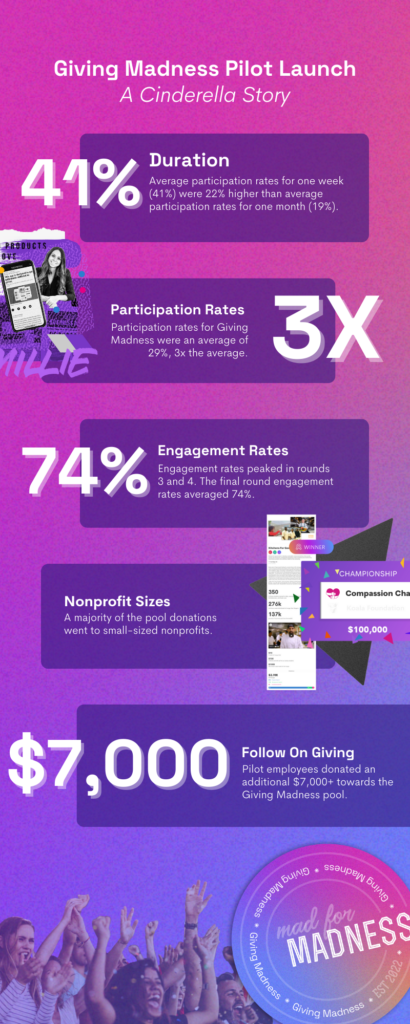
Check this out!✨ We have pulled the most noteworthy (and sometimes surprising) data from our Giving Madness: A Cinderella Story report and summarized into an infographic for you!
Introduction
Before the introduction of Giving Madness, nearly 80% of charitable donations have been made at the end of the year, leaving nonprofits hurting for funds the rest of the year. We knew if we could create a fun giving program that would close the funding gap and ignite cause engagement for employees, we could move the corporate giving needle during the quieter months.
What We Found
Duration ⛹️♂️
The average participation rates for one week brackets were 22% higher than the average participation rates for one month brackets. One week brackets had an average participation rate of 41%. Any myths that folks would need extra time to wrap their heads around gamified giving has officially been debunked. What we learned….when running a Giving Madness bracket, short term brackets are best. And did you know, we have one day brackets too!?
Participation Rates 🤸♂️
Participation rates averaged 29% during the pilot launch. We know that may sound like a low number for newbies. But the truth of this industry is that participations rates averages are fairly low. Our hope was to surpass the average corporate donation match participation rates of 11% (source: GIN 2019). Our pilot launch participation rates were nearly 3X the industry average rates!
Engagement Rates 🚴
We know people are overloaded with information and have the attention span of a goldfish nowadays. We totally get it. That’s why we were gobsmacked when our Giving Madness bracket engagement rates continued to increase with each round! Engagement rates peaked in rounds 3 and 4 with the final round bringing in an average of 74%. Engaged, indeed.
Nonprofit Sizes 🕺
We are champions for nonprofits, big and small. And we have seen small orgs make a BIG impact. So we were ecstatic when we saw that the nonprofit size category that brought in the largest amount of support was the small-sized nonprofits. Go little guys!
Follow On Giving 💓
The main goal for Giving Madness is the increase participation rates in a no pressure environment. The donation pool is solely funded by the company that is running the bracket, all the employees have to do is participate. That’s why we were so moved to see a total of over $7,000 donated to the donation pools from employees who were not encouraged to donate at all…speechless.
While these results are always a great asset for pitching social impact to your company, it is never lost on us how many social impact champions we have on the ground giving their all. These numbers are such an inspiration!
If you would like to read the full report, check out more info below.
Want to learn more?✨ You can download Giving Madness: A Cinderella Story, the full report here. There is so much more that we didn’t highlight. For example:
- Cause Areas. What causes were trending among users and was there a current event that reflected this?
- Communication. What channels of communication were recommended and did they directly affect participation?
- New sign ups. Were any employees who were not previous Millie users motivated to sign up for future ongoing match giving?
- And lots more!